----
Pdf copy of this post is available here for better formatting and math text.
-----
Teaching how to sketch a transformed graph of a function requires students to
For most functions and most transformations this hasn't been a major hurdle to deal with. There is, however, one transformation, for one set of functions that has caused me and my students grief every year. And every year I've modified and overhauled how I've taught it to make easier for students. It is horizontal translations for circular functions (sine, cosine, and tangent).
Pdf copy of this post is available here for better formatting and math text.
-----
Teaching how to sketch a transformed graph of a function requires students to
- know the shape of the untransformed graph
- know key points of the untransformed graph to transform
- know what transformations (dilations, reflections, translations) apply what operations (multiplication, multiplication by negative one, addition) to which variable (x, y)
- know how to determine the transformations from the equation of the function y=f(x) → y=Af(b(x+c))+d
For most functions and most transformations this hasn't been a major hurdle to deal with. There is, however, one transformation, for one set of functions that has caused me and my students grief every year. And every year I've modified and overhauled how I've taught it to make easier for students. It is horizontal translations for circular functions (sine, cosine, and tangent).
Why does this transformation cause so much grief?
1. There's five key points to transform them, unlike other functions which generally only have around three or four and involve symmetry rather than periodicity.
2. Horizontal translations for circular involve adding or subtracting fractions of π. If students didn't already struggle with adding or subtracting fractions with or without π, needing to do it five times does not go well for maybe 3 or 4 marks.
3. Even using a workaround to follow patterns of a quarter of the period mean the process of sketching the graph becomes less and less similar to graphing other transformed functions.
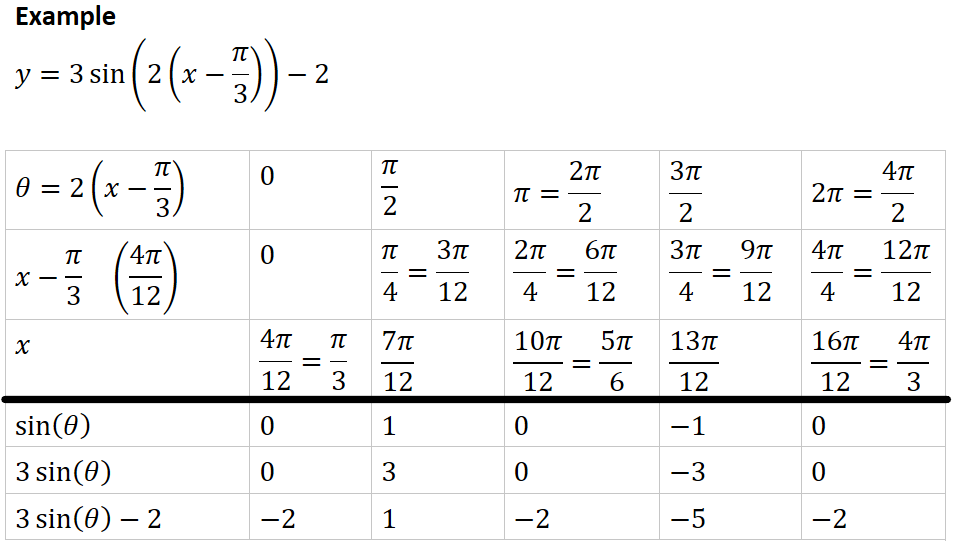
To demonstrate my new method, here's an example.
1. There's five key points to transform them, unlike other functions which generally only have around three or four and involve symmetry rather than periodicity.
2. Horizontal translations for circular involve adding or subtracting fractions of π. If students didn't already struggle with adding or subtracting fractions with or without π, needing to do it five times does not go well for maybe 3 or 4 marks.
3. Even using a workaround to follow patterns of a quarter of the period mean the process of sketching the graph becomes less and less similar to graphing other transformed functions.
To demonstrate my new method, here's an example.
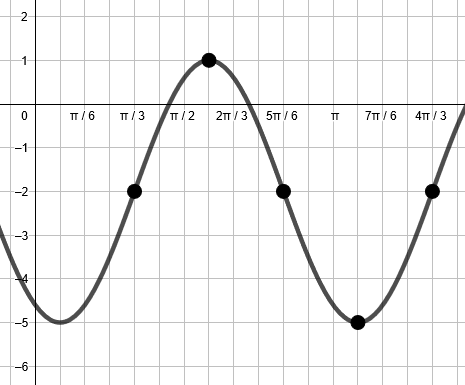
The x- and y-intercepts can be found by usual means of substituting 0 for and respectively if required (often they are not asked for if they are not exact values). If a wider domain than a single period is required, the pattern of points can be continued left or right.
What I've started to do now
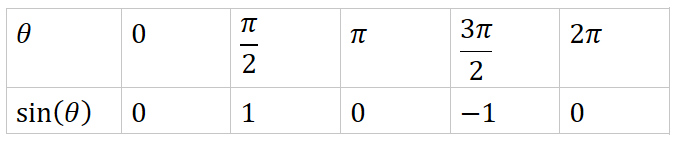
I've started using tables of values in a different way to usual. It starts with a table of key points. I intentionally am not using here since it is not the final x-value. It also means there is less to write for the y-values.
What I've started to do now
I've started using tables of values in a different way to usual. It starts with a table of key points. I intentionally am not using here since it is not the final x-value. It also means there is less to write for the y-values.
For each row, we apply the transformations to θ and sin(θ) to get them to the desired function. For the inside part, we solve our way to . For the outside part, we apply the operations.
The argument can have operations applied to it to get , or an equation can be set up and solved which also makes the the horizontal transformations more obvious (as they are backwards to normal):
The argument can have operations applied to it to get , or an equation can be set up and solved which also makes the the horizontal transformations more obvious (as they are backwards to normal):
- a dilation by a factor of a 1/2 parallel to the x-axis, then
- a translation of π/3 units right
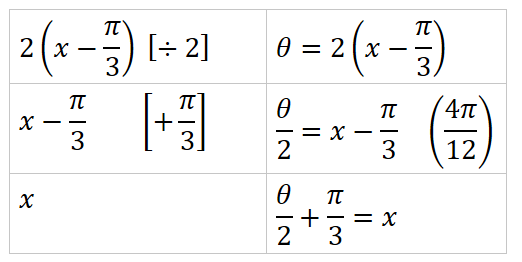
Doing this in two steps simplifies the process, as does getting common denominators.
It also means when the argument is not factorised, we can still solve to determine the horizontal transformations such as θ=2x+π to x=0.5(θ-π) which is individually applied to each point.
Why I think I will stick with it
What started as a way to make sketching circular functions that had been translated horizontally easier to teach and easier to perform by hand, has become a unifying method of sketching the graph of any transformed function, given an initial table of values and a knowledge of the shape of the graph.
This is important, because the more consistent we can make applying a process, the better. From an Engelmann perspective, I've designed a cognitive routine by not assuming existing procedures that have been developed are the only ones possible, and that works for the widest range of examples possible, that is for any function a table of values for key points can be made.
In addition, for the students I have used this method with, they have found it significantly less confusing than students of a similar ability learning the same concept using other methods I've tried in the past.
This should also make the explanation of why the horizontal transformations are "backwards" in the equation, unlike the vertical transformations, easier since they are getting the x and y values they need to plot by solving and applying operations respectively. They can see how the values are changing from the basic function to the transformed function.
The process should also work for composite functions, but may need to be modified to allow for sum, difference, product, and quotient functions.
How I plan to use it
The benefit of this process working for just about any function is that in can be introduced early with simple functions such as lines and parabolas. Once students are familiar with the process, graphs of new functions can be introduced by plotting set of points to determine the shape and from which a key set of points can be identified (or the ones that are simplest to transform).
Now, for the simpler graphs, the table can be covertised and faded out as the calculations are performed mentally. Introducing the table from the start is to give students a structure to organise their calculations and get them used to it so they can take advantage of the structure for more complicated graphs.
x- and y-intercepts may still need to be determined if they do not appear in the table and are reasonable to calculate. This would be a process I would separate from using the table to begin with to increase practice of using the table.
At the time of writing I still need to integrate this method into my notes.
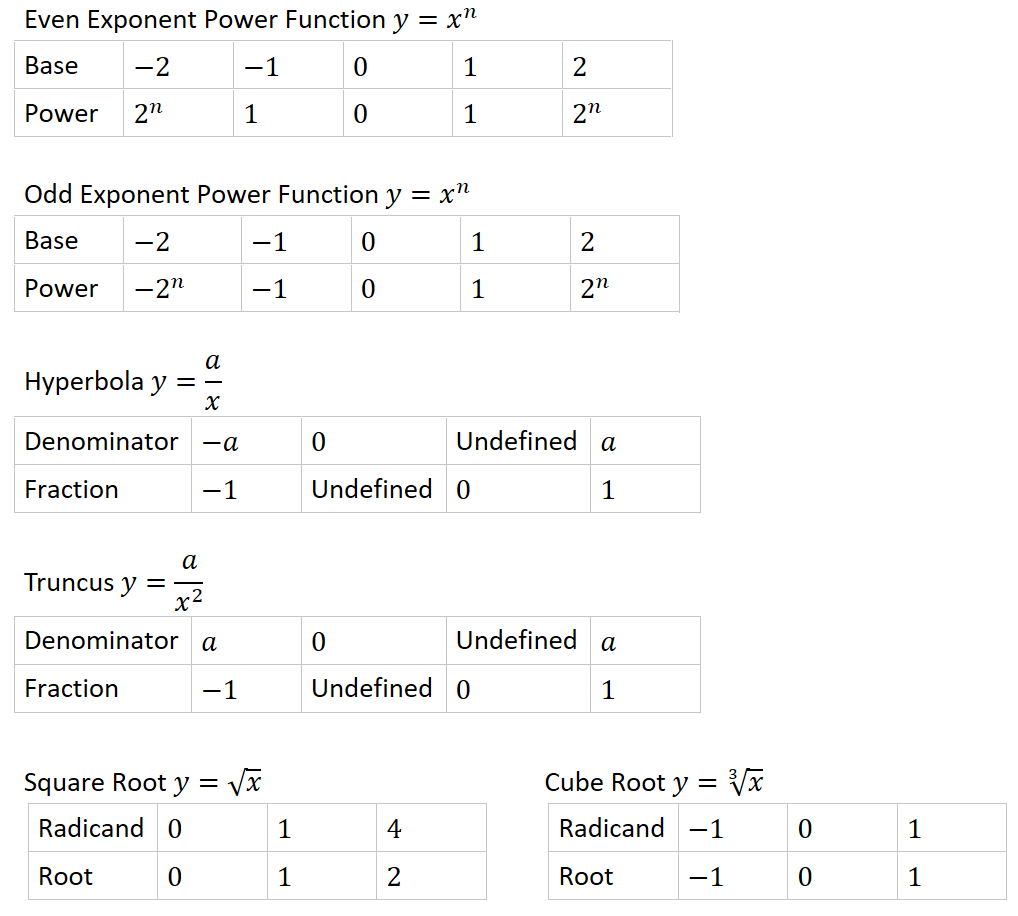
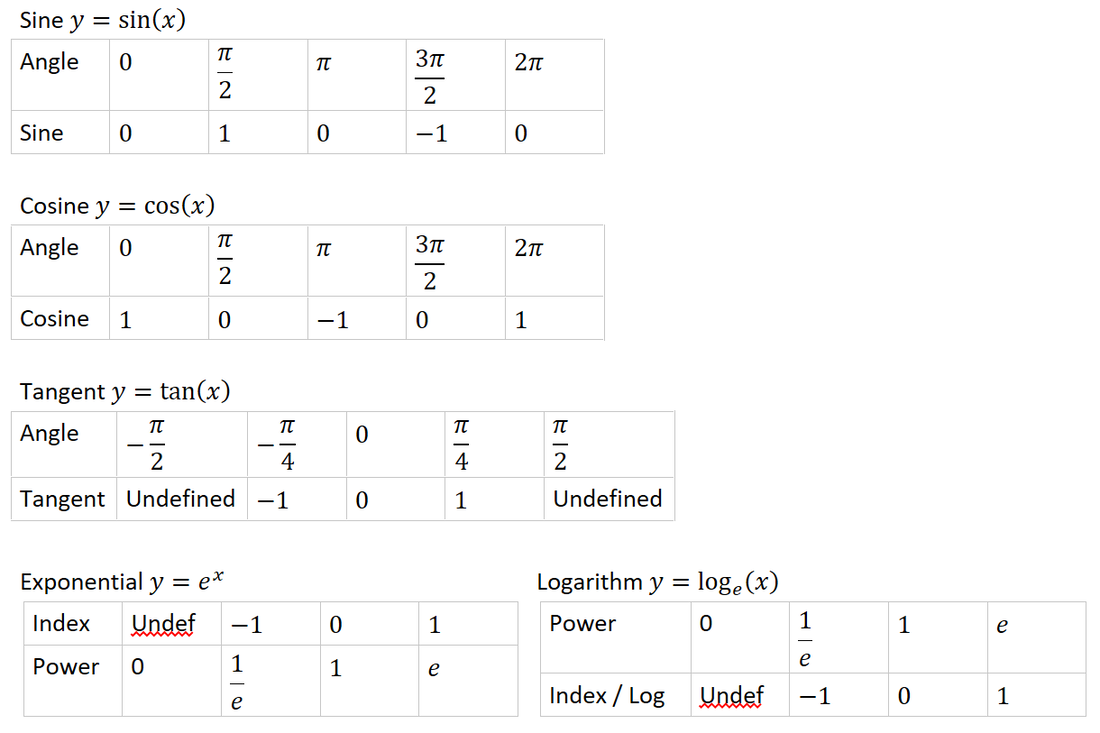
Tables of Values
I've included a set of possible tables for a number of functions you can try sketching some graphs with. Undefined values indicate a discontinuity, generally an asymptote.
It also means when the argument is not factorised, we can still solve to determine the horizontal transformations such as θ=2x+π to x=0.5(θ-π) which is individually applied to each point.
Why I think I will stick with it
What started as a way to make sketching circular functions that had been translated horizontally easier to teach and easier to perform by hand, has become a unifying method of sketching the graph of any transformed function, given an initial table of values and a knowledge of the shape of the graph.
This is important, because the more consistent we can make applying a process, the better. From an Engelmann perspective, I've designed a cognitive routine by not assuming existing procedures that have been developed are the only ones possible, and that works for the widest range of examples possible, that is for any function a table of values for key points can be made.
In addition, for the students I have used this method with, they have found it significantly less confusing than students of a similar ability learning the same concept using other methods I've tried in the past.
This should also make the explanation of why the horizontal transformations are "backwards" in the equation, unlike the vertical transformations, easier since they are getting the x and y values they need to plot by solving and applying operations respectively. They can see how the values are changing from the basic function to the transformed function.
The process should also work for composite functions, but may need to be modified to allow for sum, difference, product, and quotient functions.
How I plan to use it
The benefit of this process working for just about any function is that in can be introduced early with simple functions such as lines and parabolas. Once students are familiar with the process, graphs of new functions can be introduced by plotting set of points to determine the shape and from which a key set of points can be identified (or the ones that are simplest to transform).
Now, for the simpler graphs, the table can be covertised and faded out as the calculations are performed mentally. Introducing the table from the start is to give students a structure to organise their calculations and get them used to it so they can take advantage of the structure for more complicated graphs.
x- and y-intercepts may still need to be determined if they do not appear in the table and are reasonable to calculate. This would be a process I would separate from using the table to begin with to increase practice of using the table.
At the time of writing I still need to integrate this method into my notes.
Tables of Values
I've included a set of possible tables for a number of functions you can try sketching some graphs with. Undefined values indicate a discontinuity, generally an asymptote.
 RSS Feed
